Create a Site Experience | Bizzdesign
Enterprise Architects needed a better way of creating Sites(Presentations) and share them with business stakeholders. However Bizzdesign has two different product Enteprise Studio and Horizzon and making changes to what happens in their modeling app Enteprise Studio was out of scope. How did we handle that?
Perform a UX audit on the current experience and design an incremental improvement which is much better for the users irregardless of the technical limitations faced by Bizzdesign.

For this project, Contextual design methodology was utilised. We had a contextual inquiry with an enterprise architect which of course included an interview and an observation of him interacting with the feature. Afterwards, we interpreted the session and visualised our findings in work models and an affinity diagram. We then created storyboards and redesigned the system in order to better meet his needs.

One useful way of differentiating between the different explanation needs is based on the types of questions users might want to ask the model.
In the domain of context-aware computing, the following types of questions are defined:
Input, Output, What, Why, Why Not, How, What If, How to, and Certainty


The project started with a remote interview with screen sharing with a consultant at BiZZdesign. This participant was chosen, because he is frequently using the feature. The consultant creates sites on a regular basis for demonstration purposes and he also often helps customers struggling with it.
The consultant was asked to interact with the feature while thinking aloud. Many issues were observed during the session, which you can see in the video below.


The issues the user had with the system were discovered and organised into an Affinity diagram of breakdowns, which you can see below. Some of them were issues he is facing daily with this feature. Some come directly from customer complaints and some we discovered during the interview. The issues were clustered into 3 different groups - General, Scope and start view and Sharing and publishing. Moreover, a flow model was created for this use case.
The Flow Model captures communication and coordination between people to accomplish work. It showed who the user interacts with, what do they exchange with each other, individuals’s tasks and where the breakdowns occur. And finally, a storyboard was designed to better visualise the user’s journey and achieve a common understanding.


.png)
User requirements were defined in the form of user stories. As the step-by-step wizard was chosen as the leading design pattern for this project it made sense to organise the user stories around the user flow of creating a site.
Illustrations of Rotterdam hotspots to be used in promotional materials about living in Rotterdam.
Tools:
Illustrator

A wizard was chosen for the final design. It could help guide the user through the different steps needed to create a useful site.


Low-fi prototype
Improvements
4 usability tests were conducted to evaluate the first prototype’s usability and clarity.
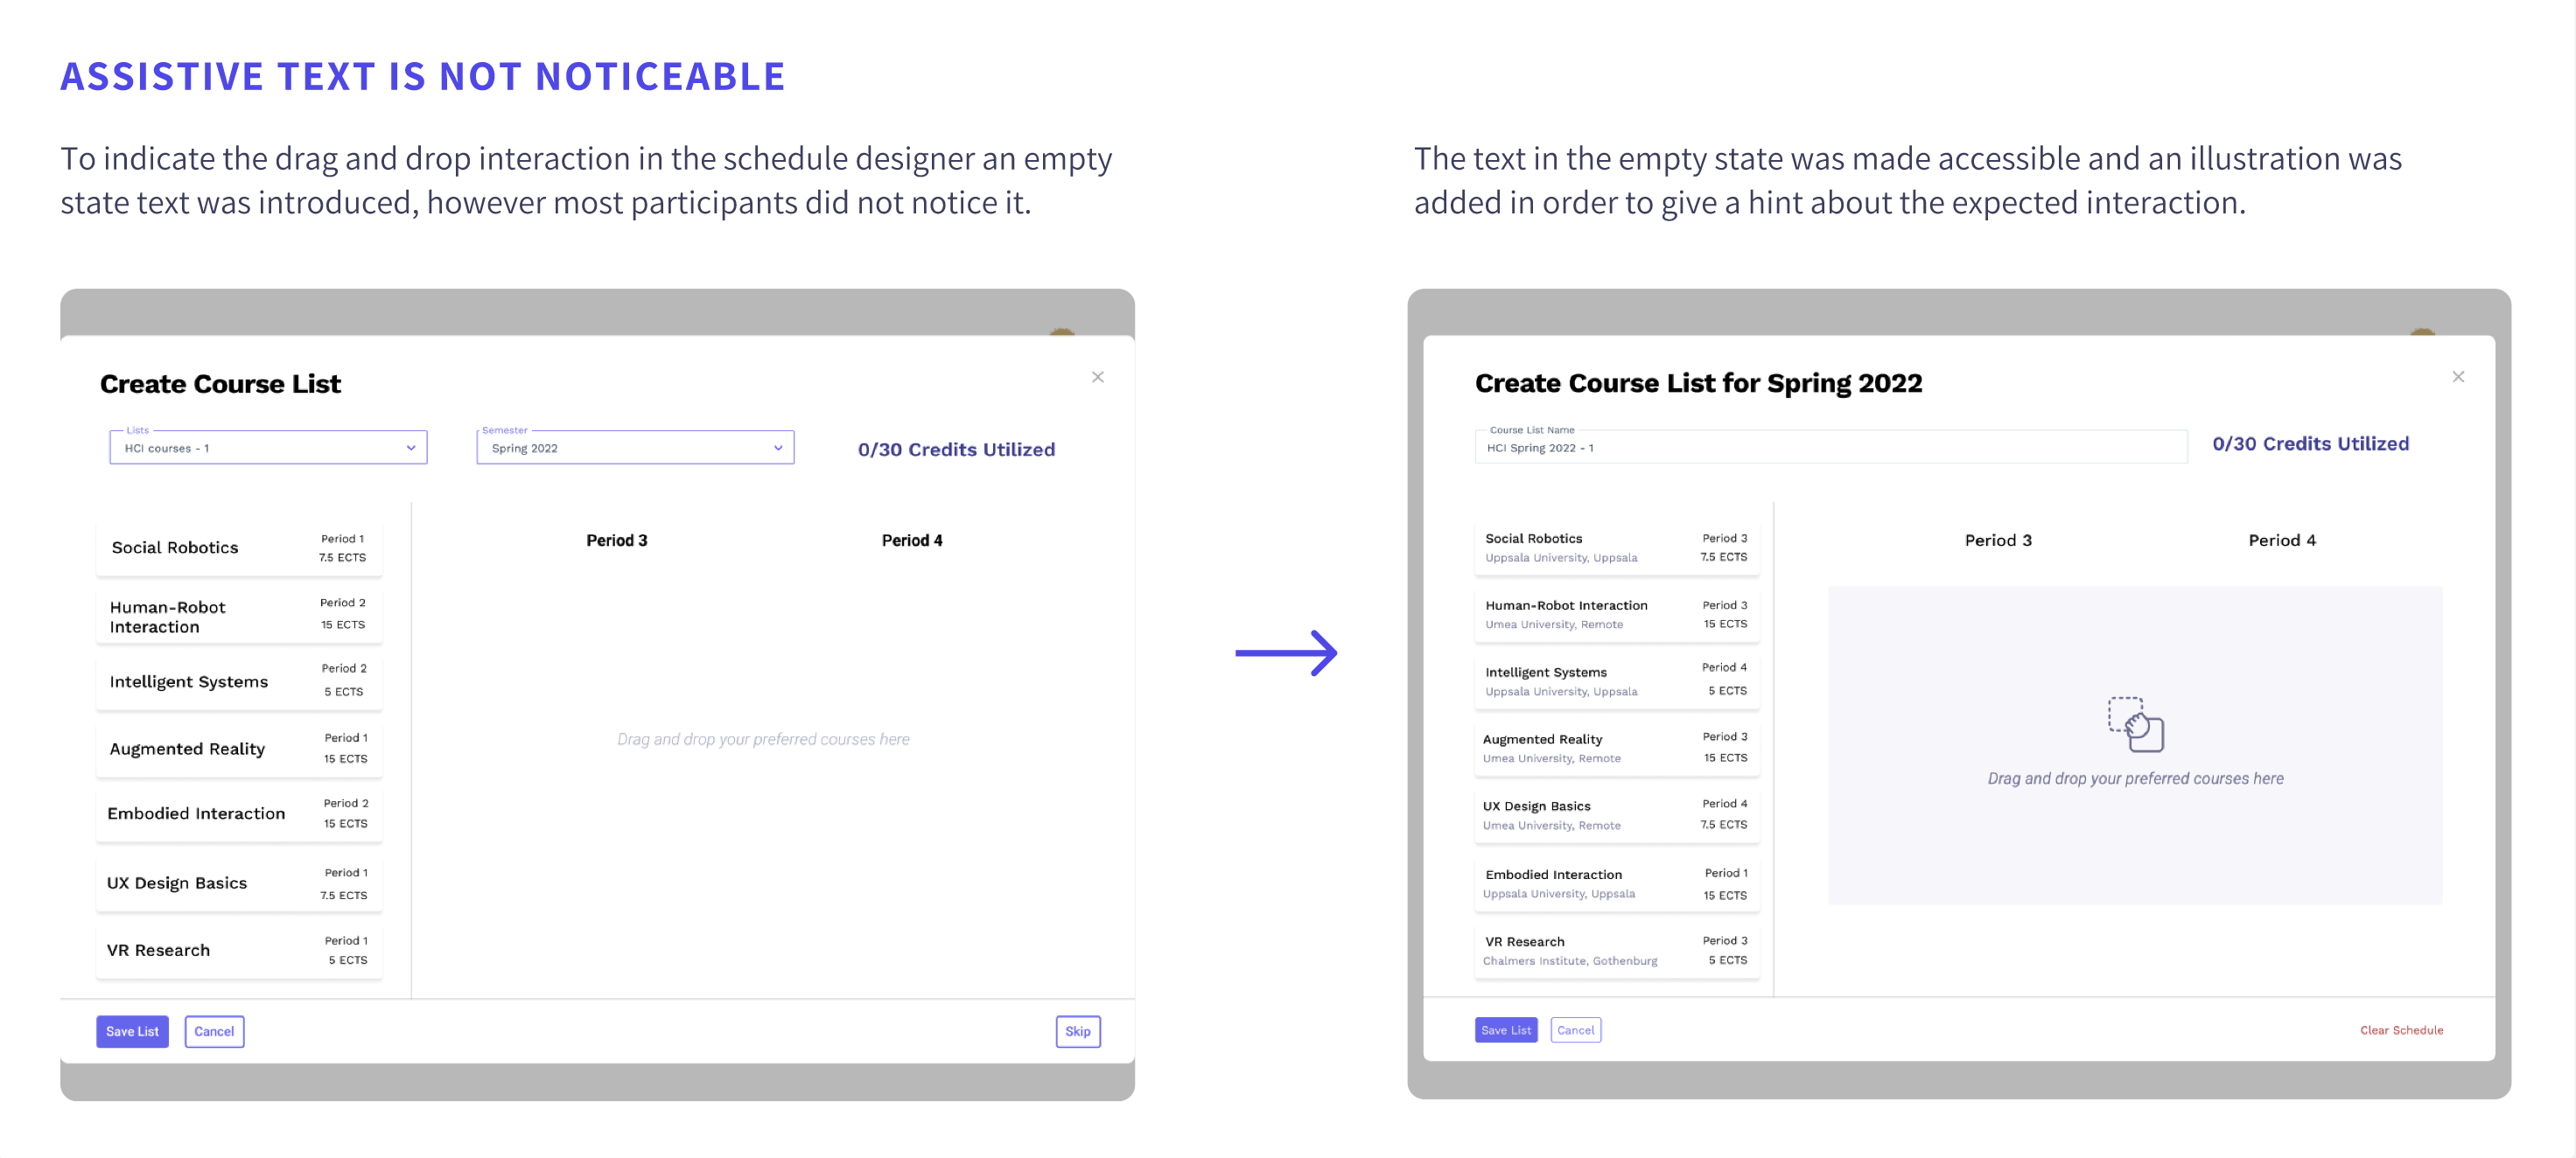
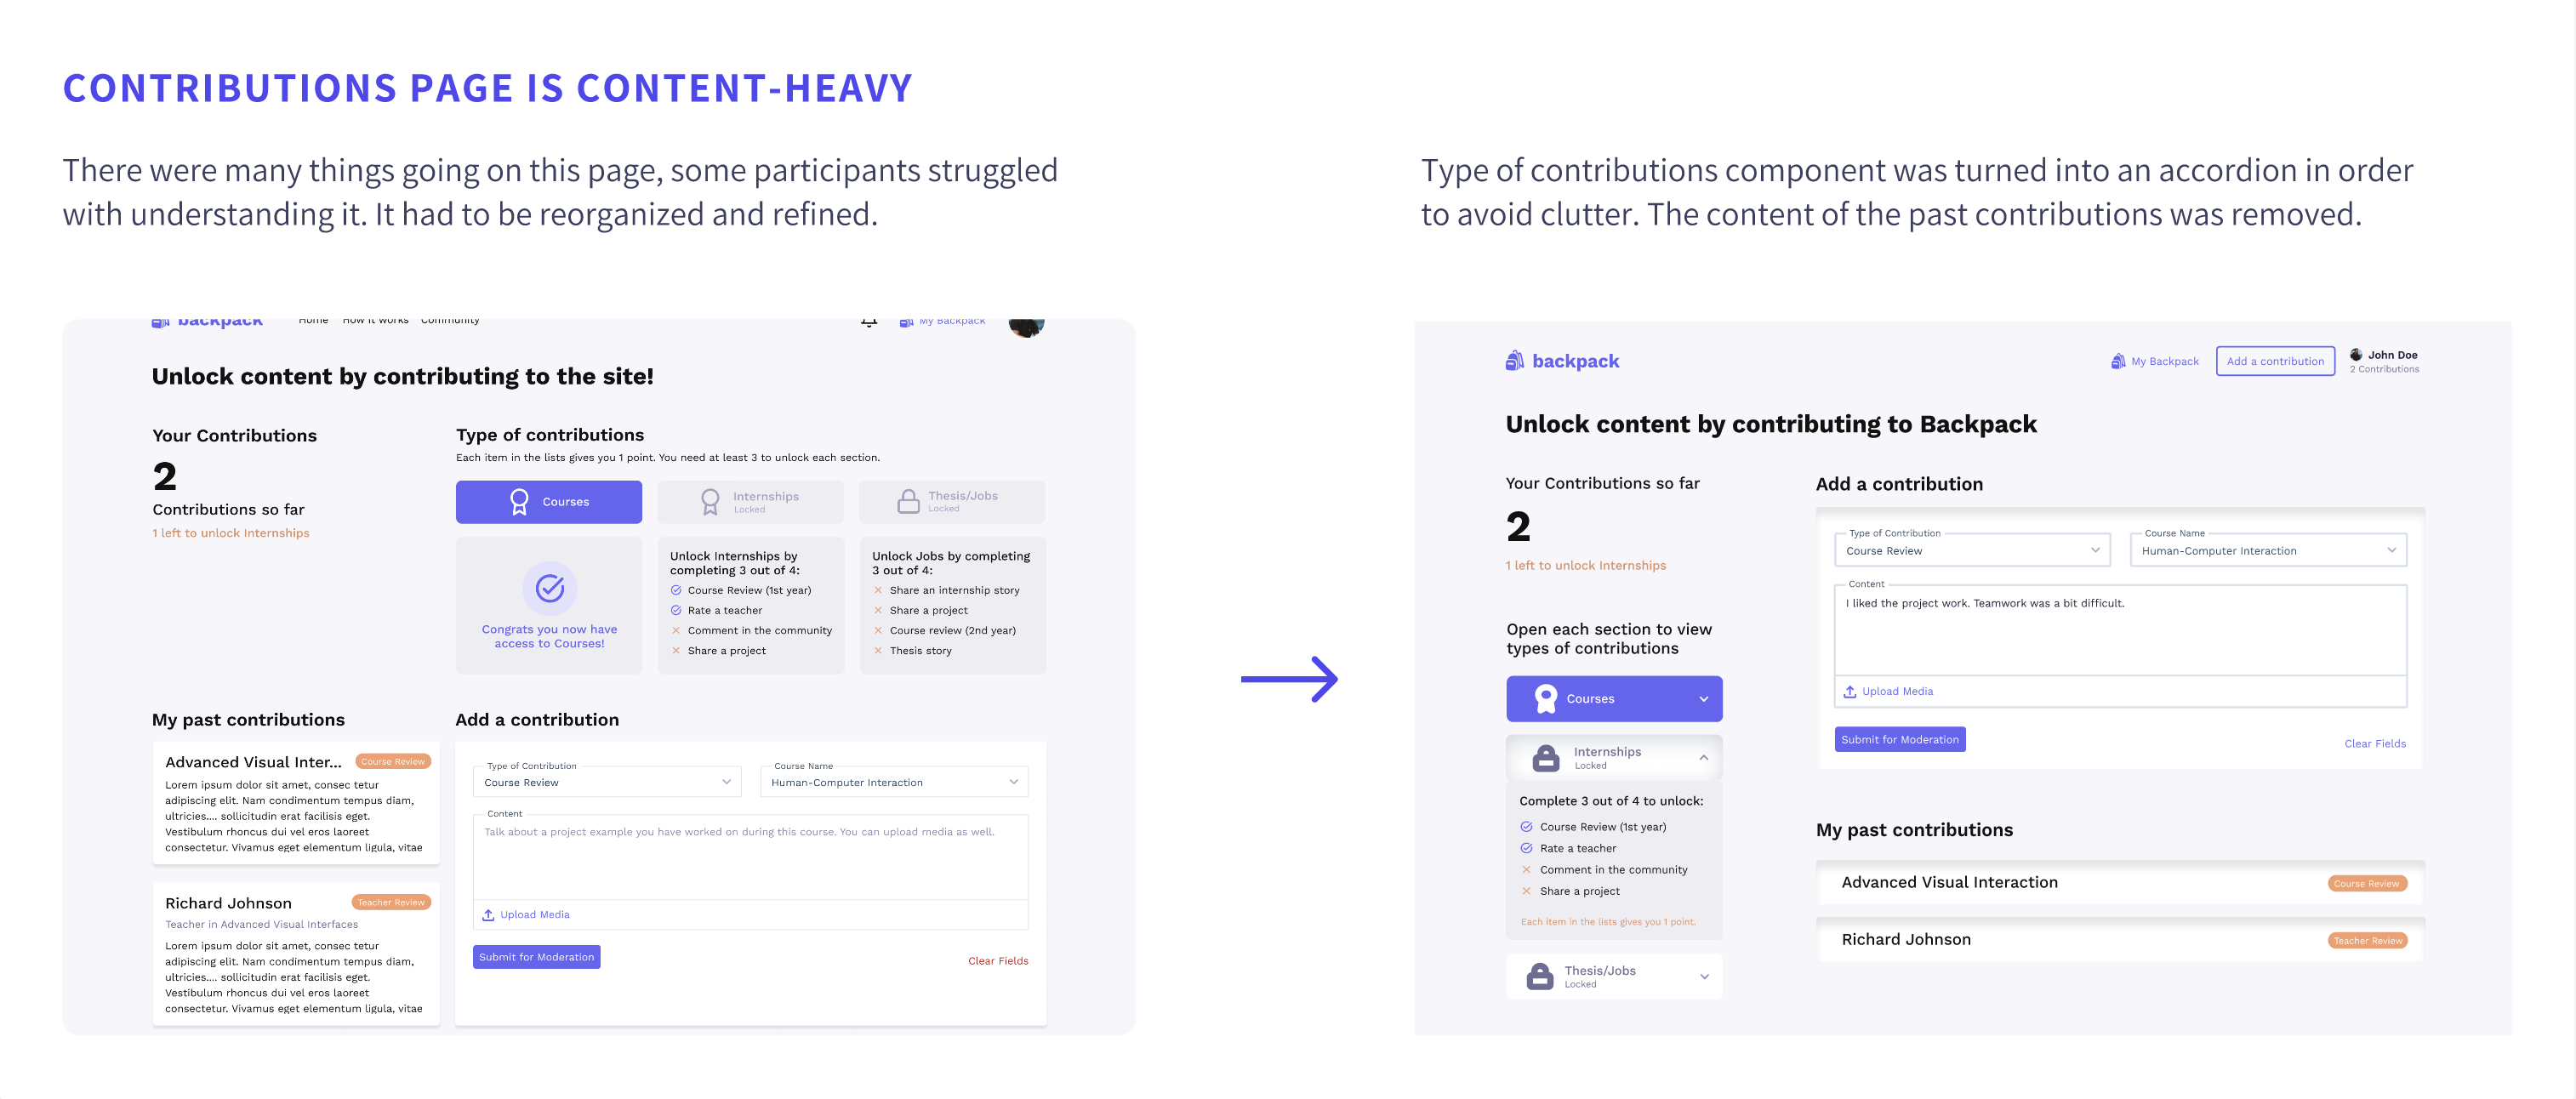
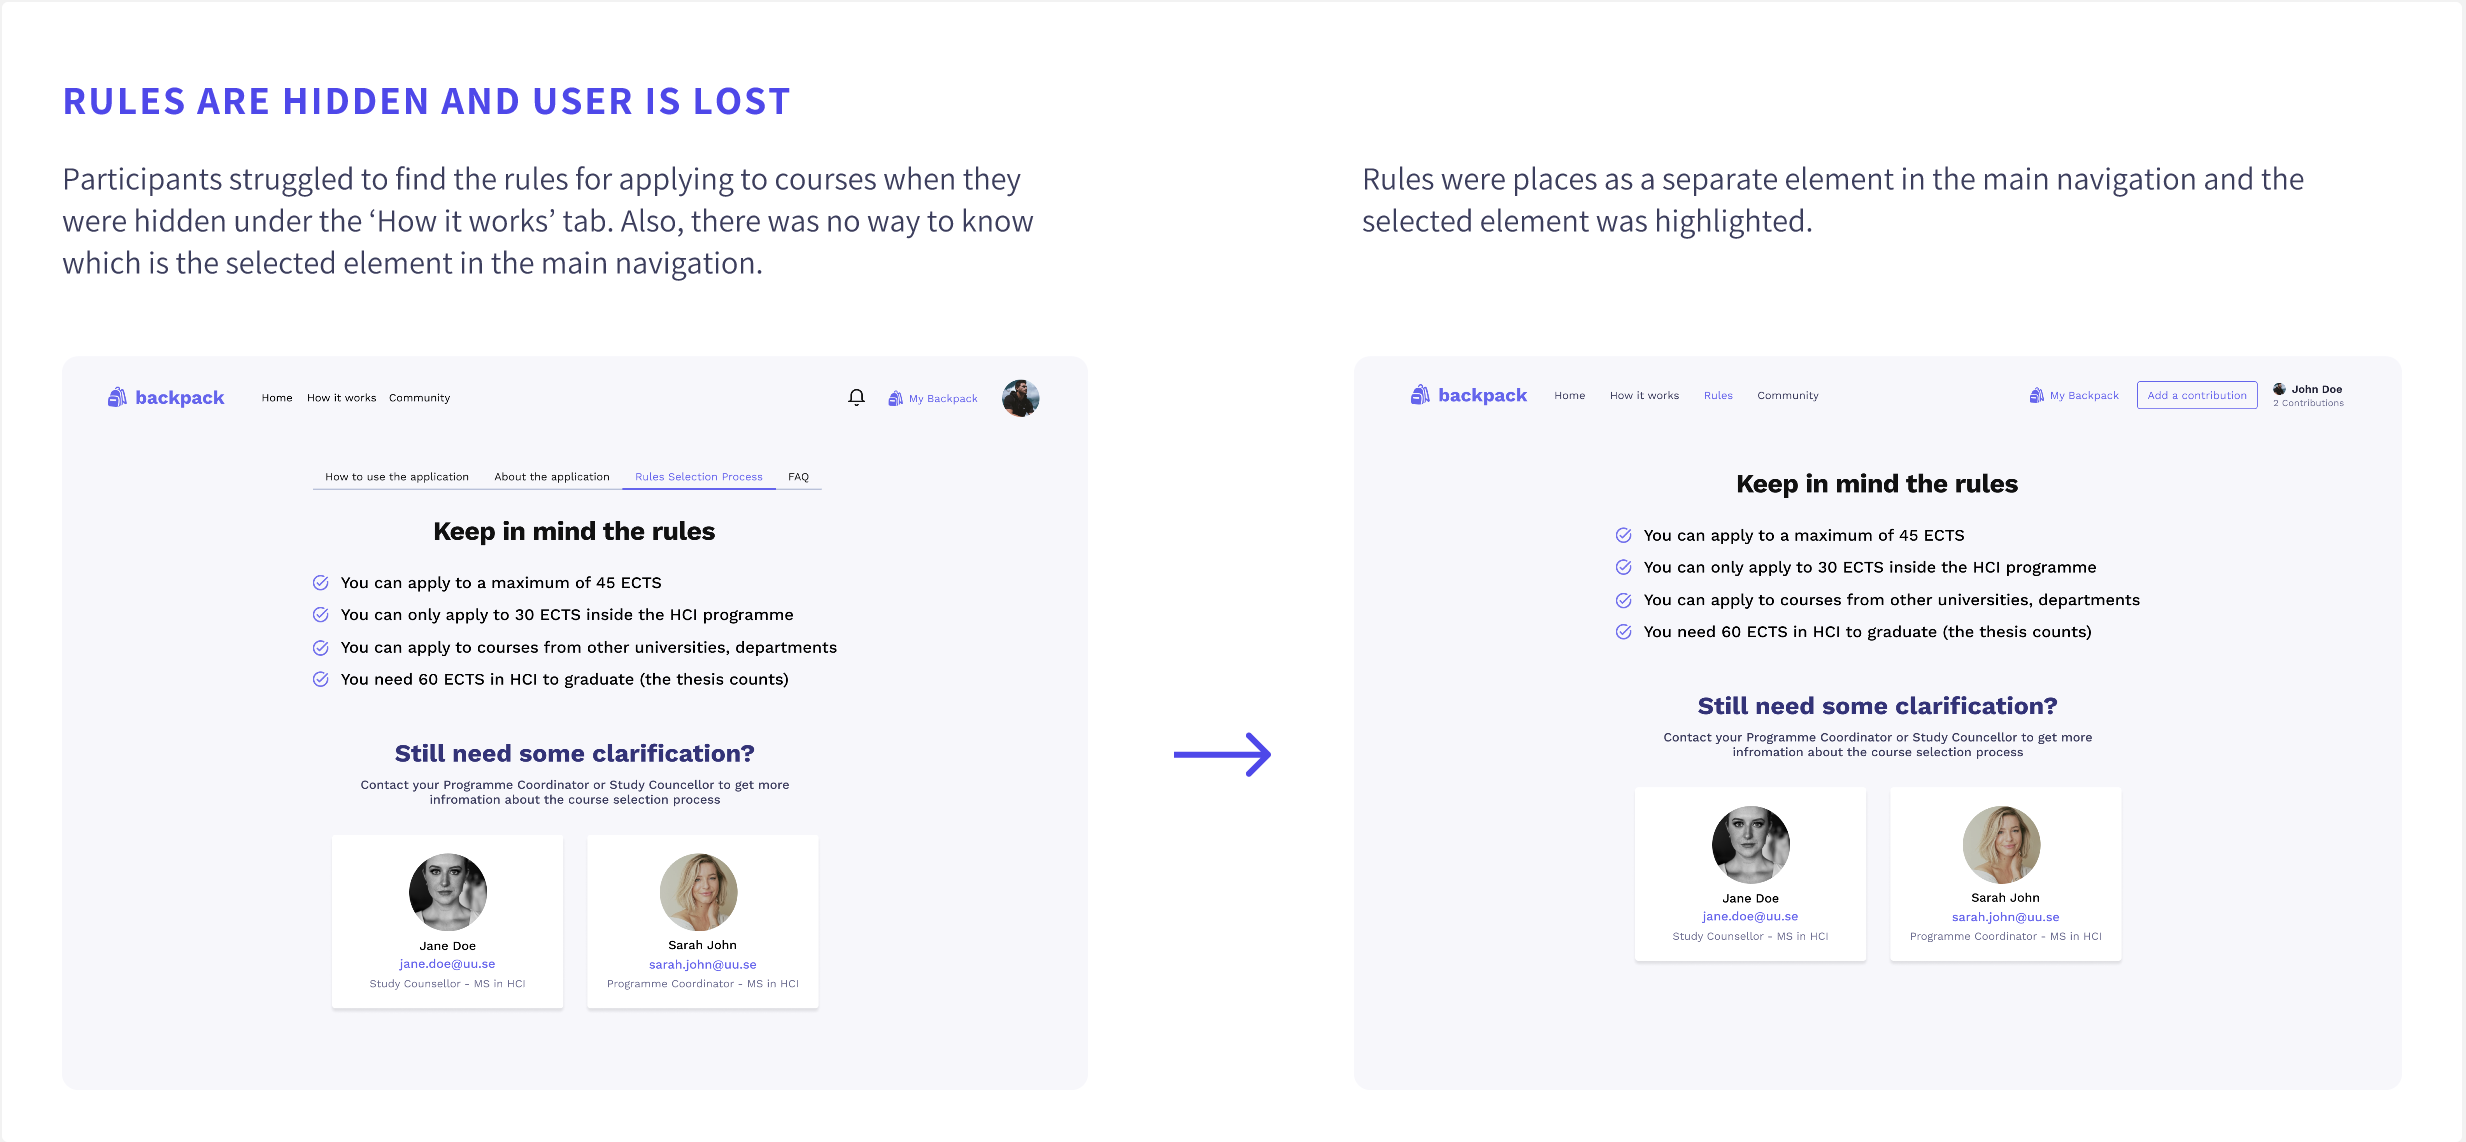
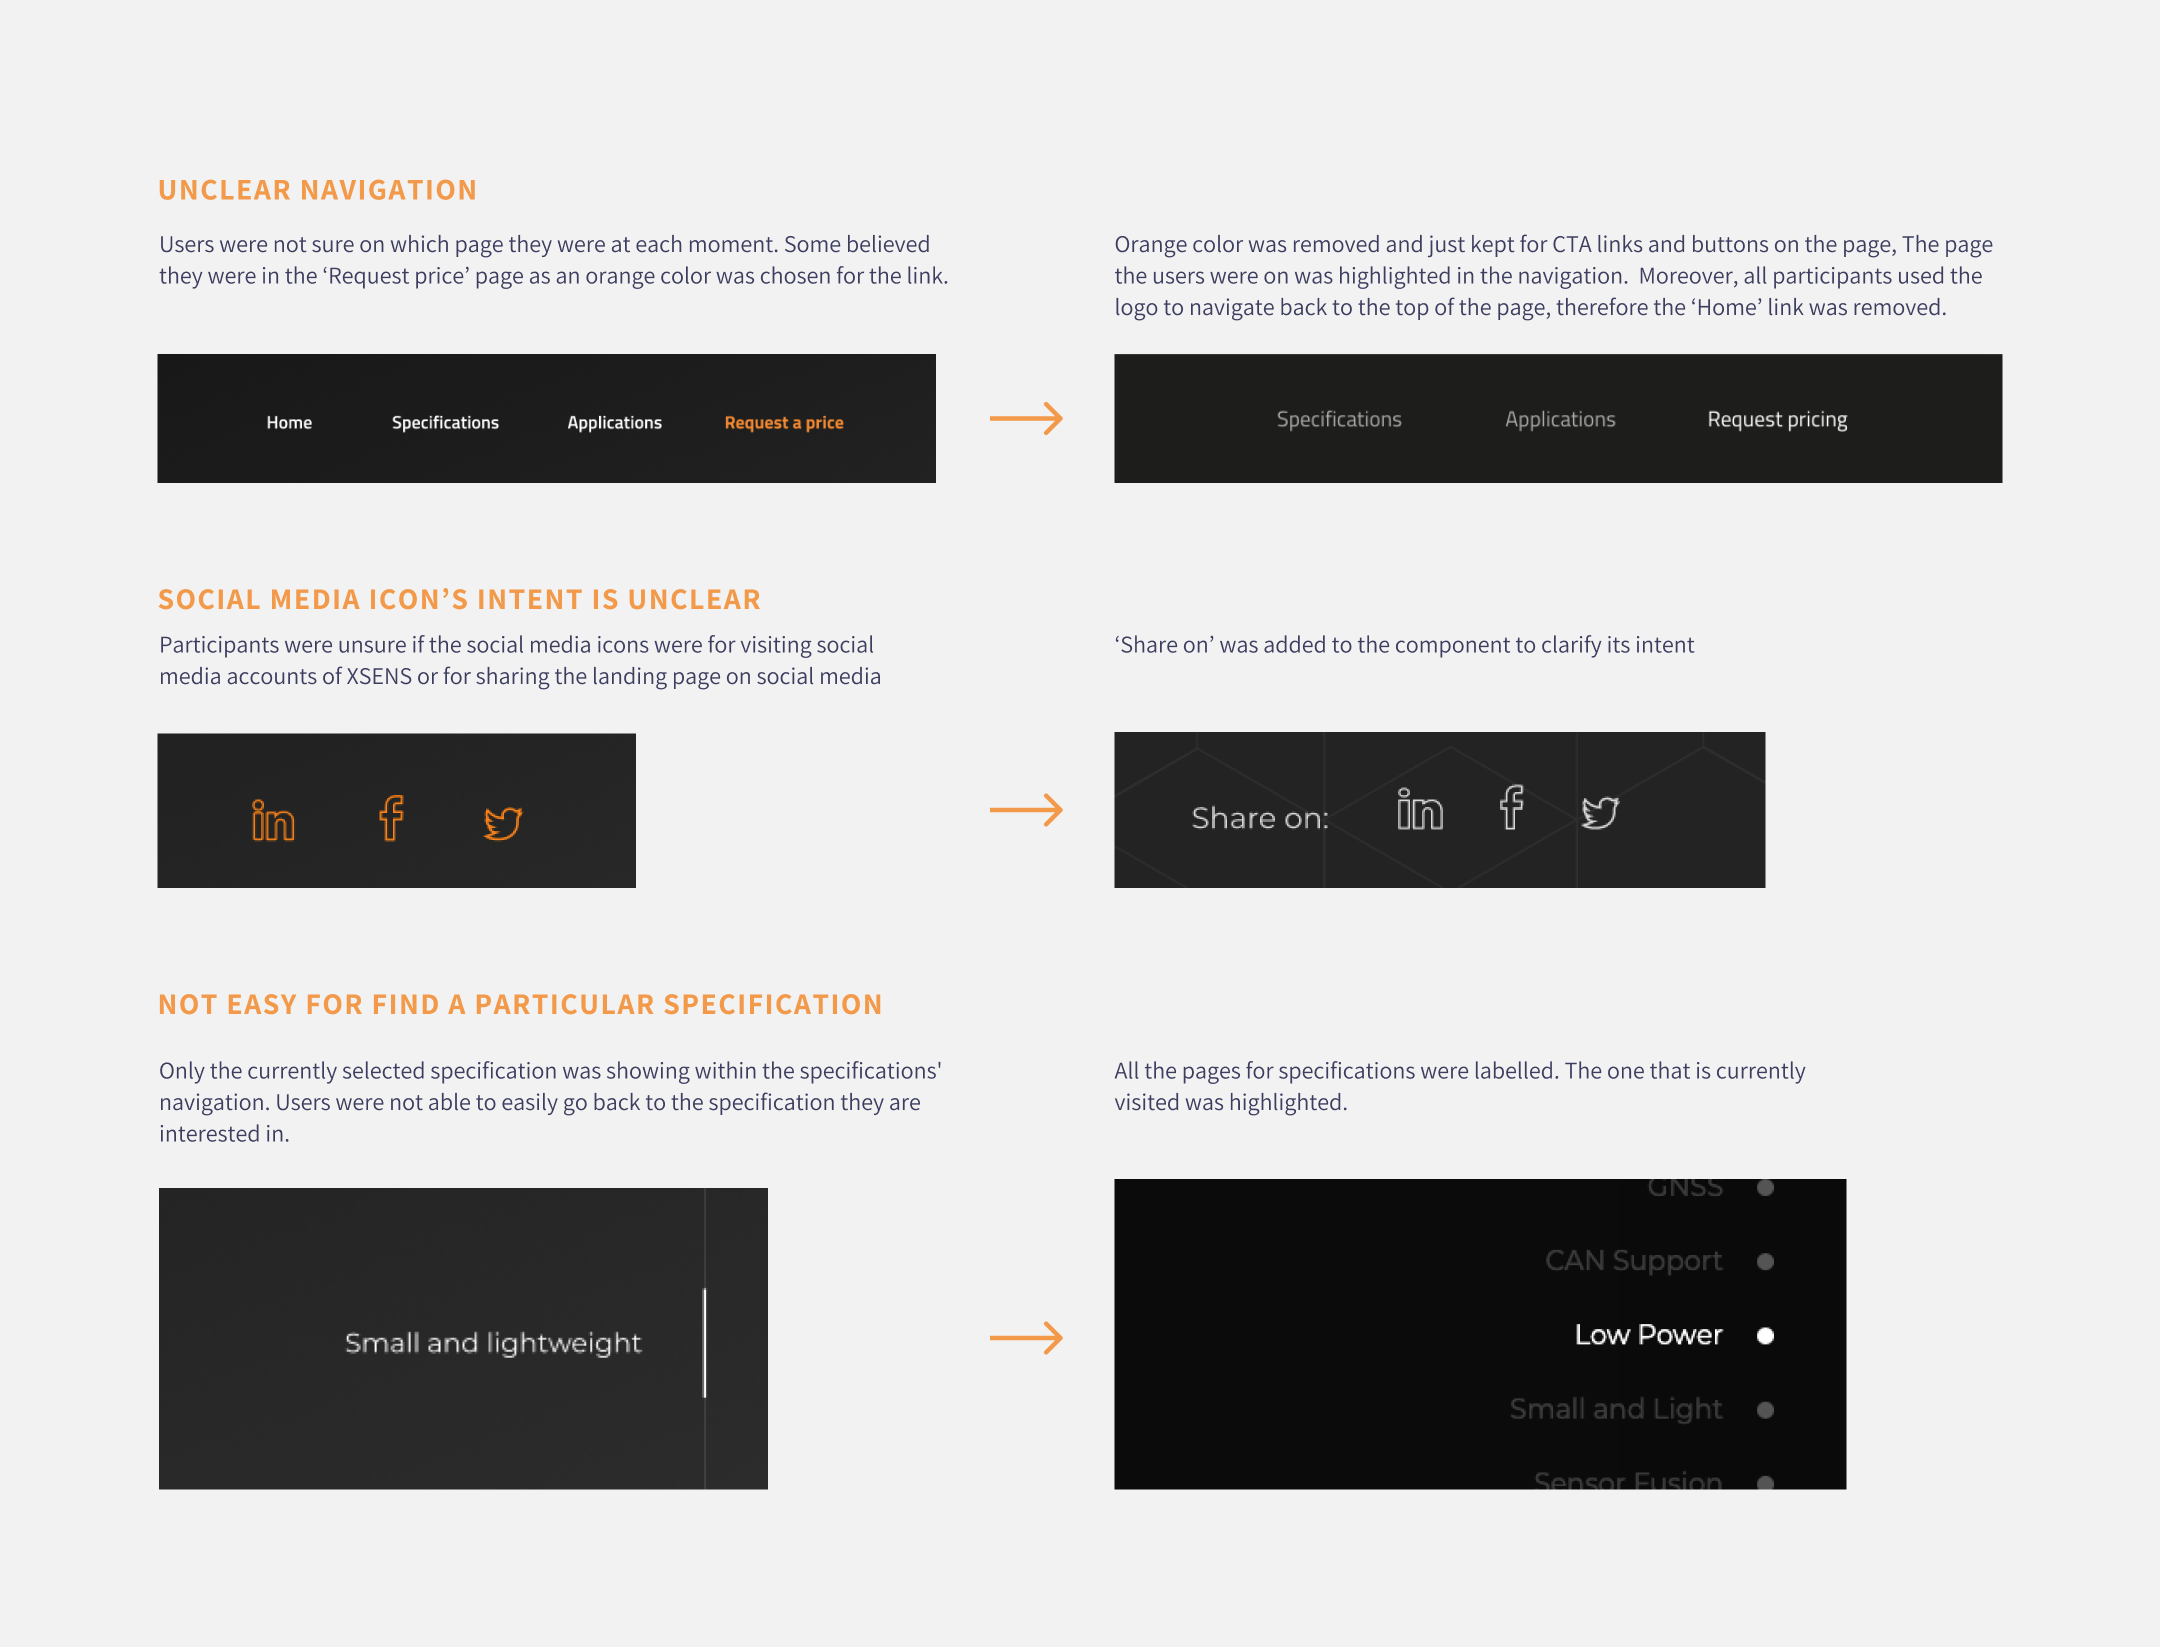
Afterwards, the prototype was improved based on the findings. Some of the issues spotted during the usability tests are described below together with their improvements.
A simple design system was created to ensure consistency and speed up the high-fidelity design process.
You can access the design system from here.
.png)
The final high-fidelity designed prototype can be accessed at this link.
Or please watch the video below.
Once the web page was live click map and heatmap analysis could be made as all animations were now running smoothly and all interactions worked as expected.
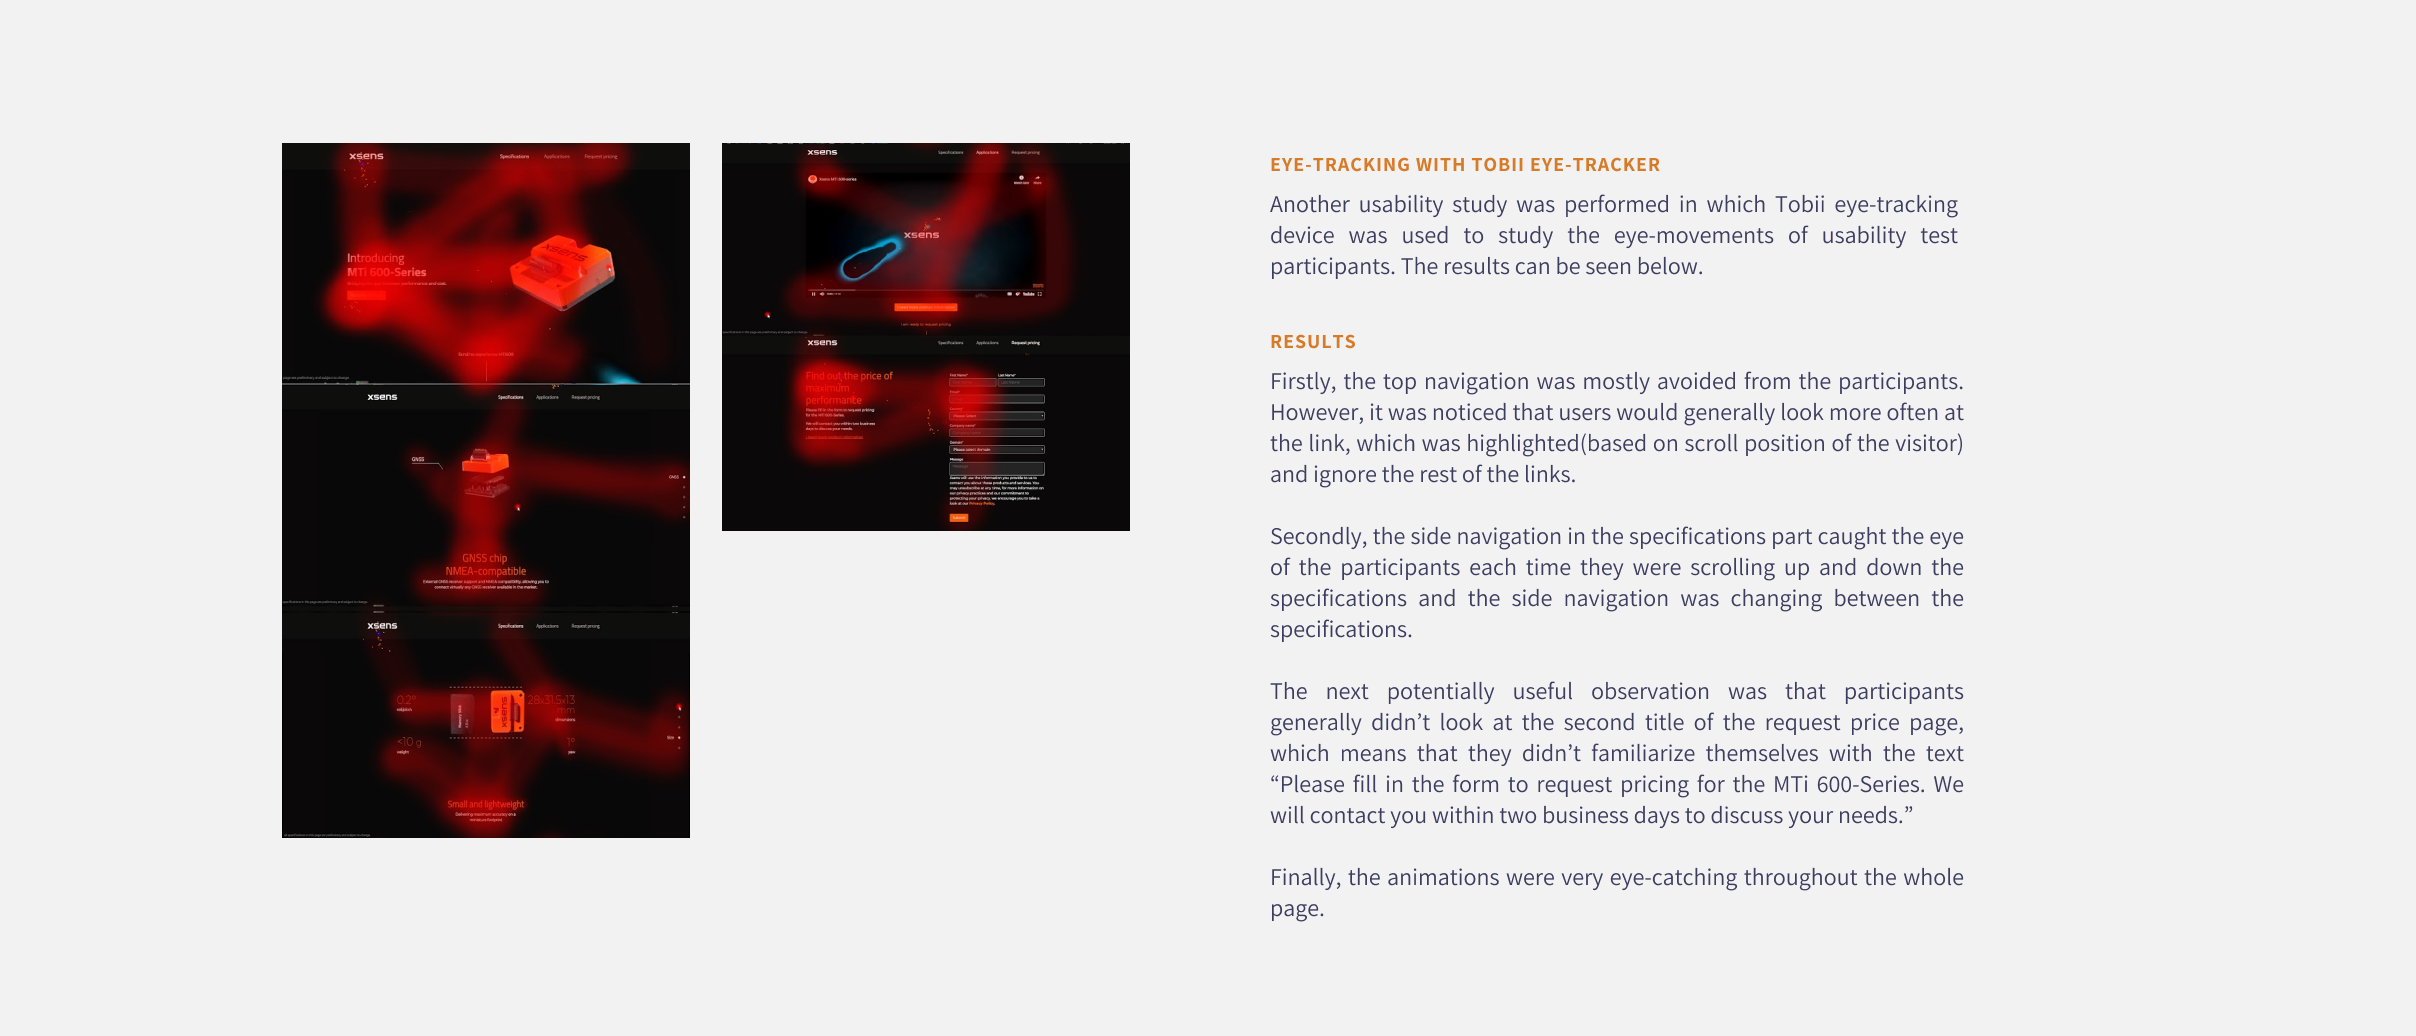
Tobii eye tracker was used in another set of user tests in order to be find out which elements on the page attract the most attention and which are missed and see if we could use this information to optimise the page further in the future. A heatmap was generated based on the results.
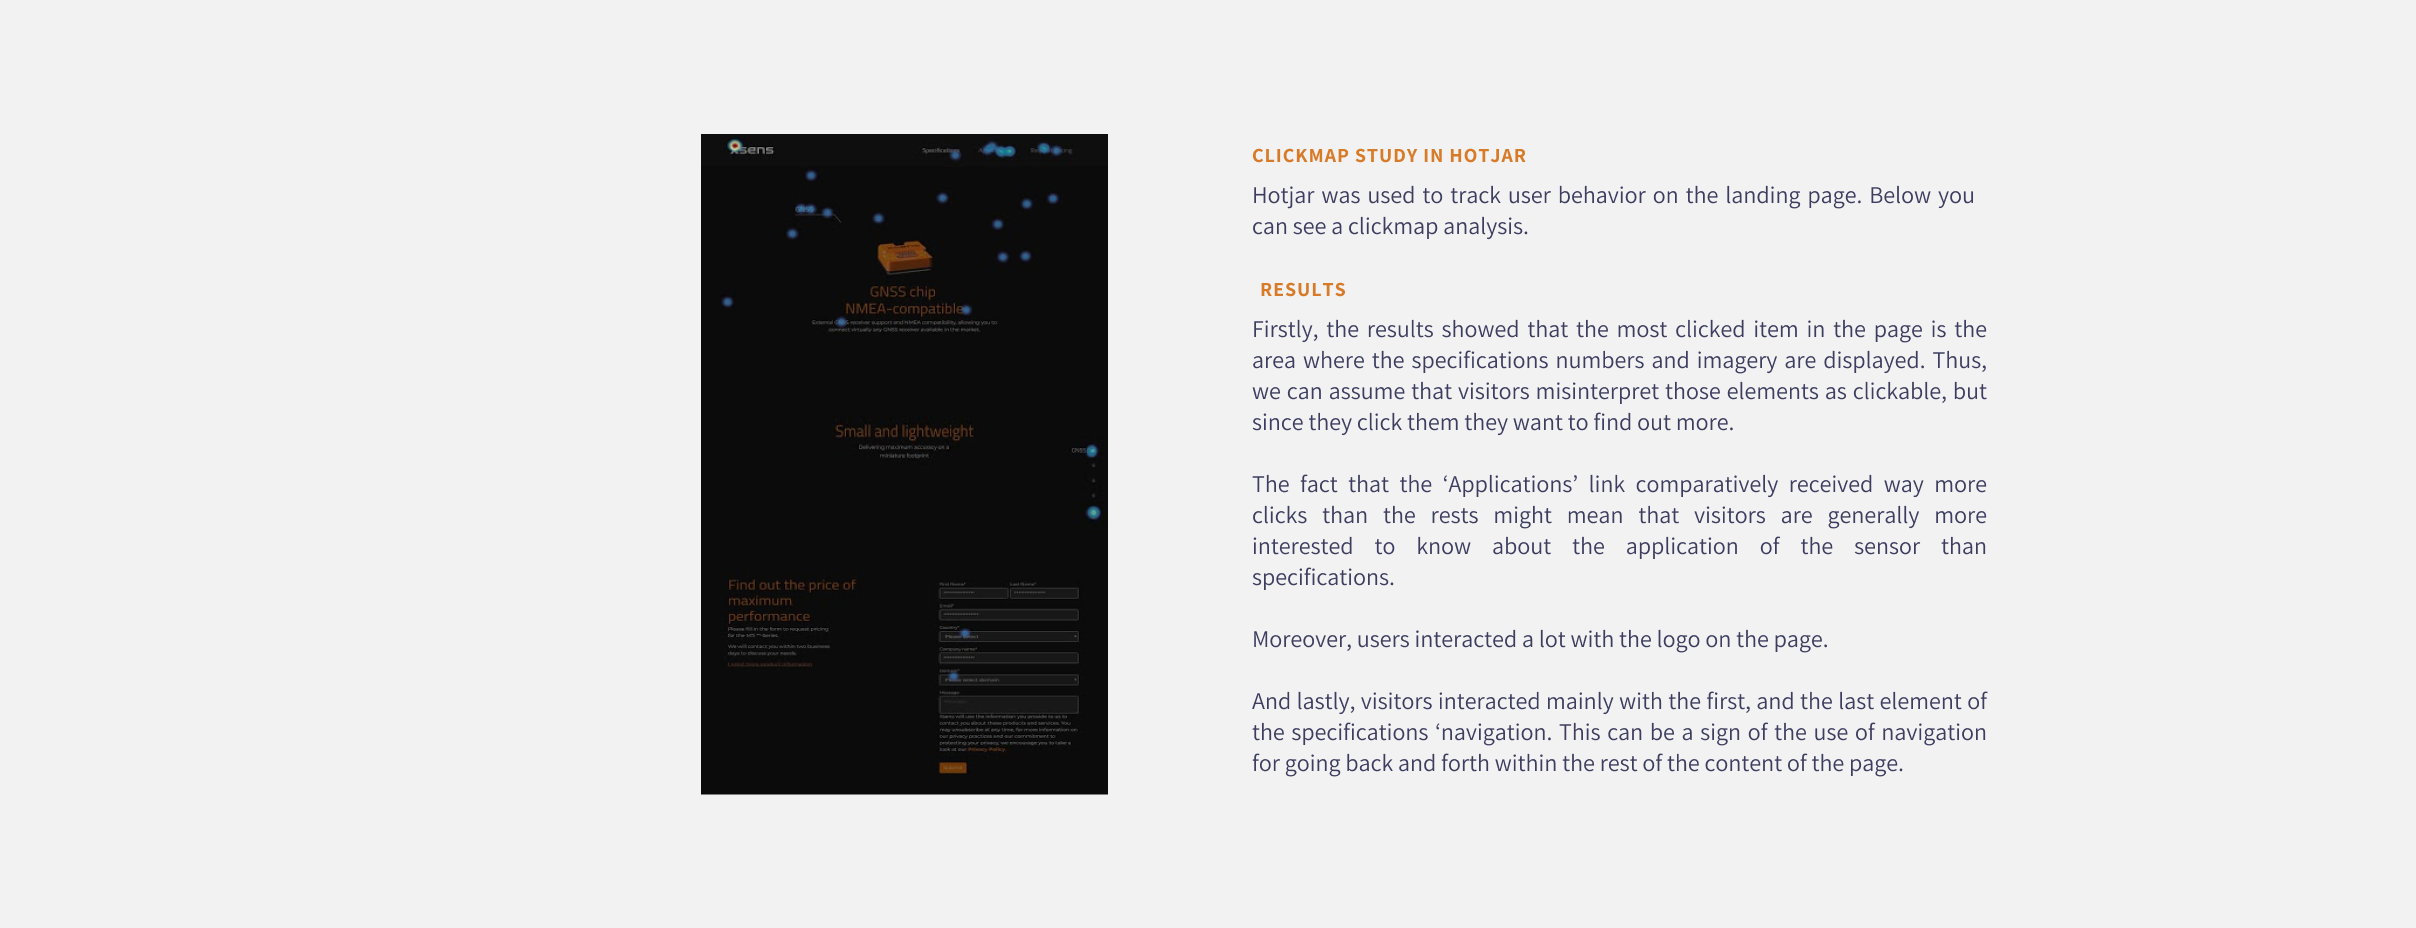
Moreover, a clickmap was extracted from Hotjar which showed us where do users clicked the most on the live page.
Usual scenario
Unsual scenario
Due to limited access to end users, an expert evaluation was conducted by 3 UX Designers. The results are shown below. There was not enough time to implement changes, but the evaluation was carefully documented.


Improvements were made based on the major issues found during the usability tests. Some are mentioned below.